Background
Inside TikTok's hit factory: the data, the patterns, and who it's for
TikTok has transformed the music industry by making virality a key driver of success. However, this algorithm-driven popularity has also led to a homogenization of sound, with artists optimizing their music to fit TikTok trends.
This project explores how data visualization can help uncover the patterns behind viral TikTok songs and provide insights for artists, producers, and industry professionals.
Data Sources and Characteristics
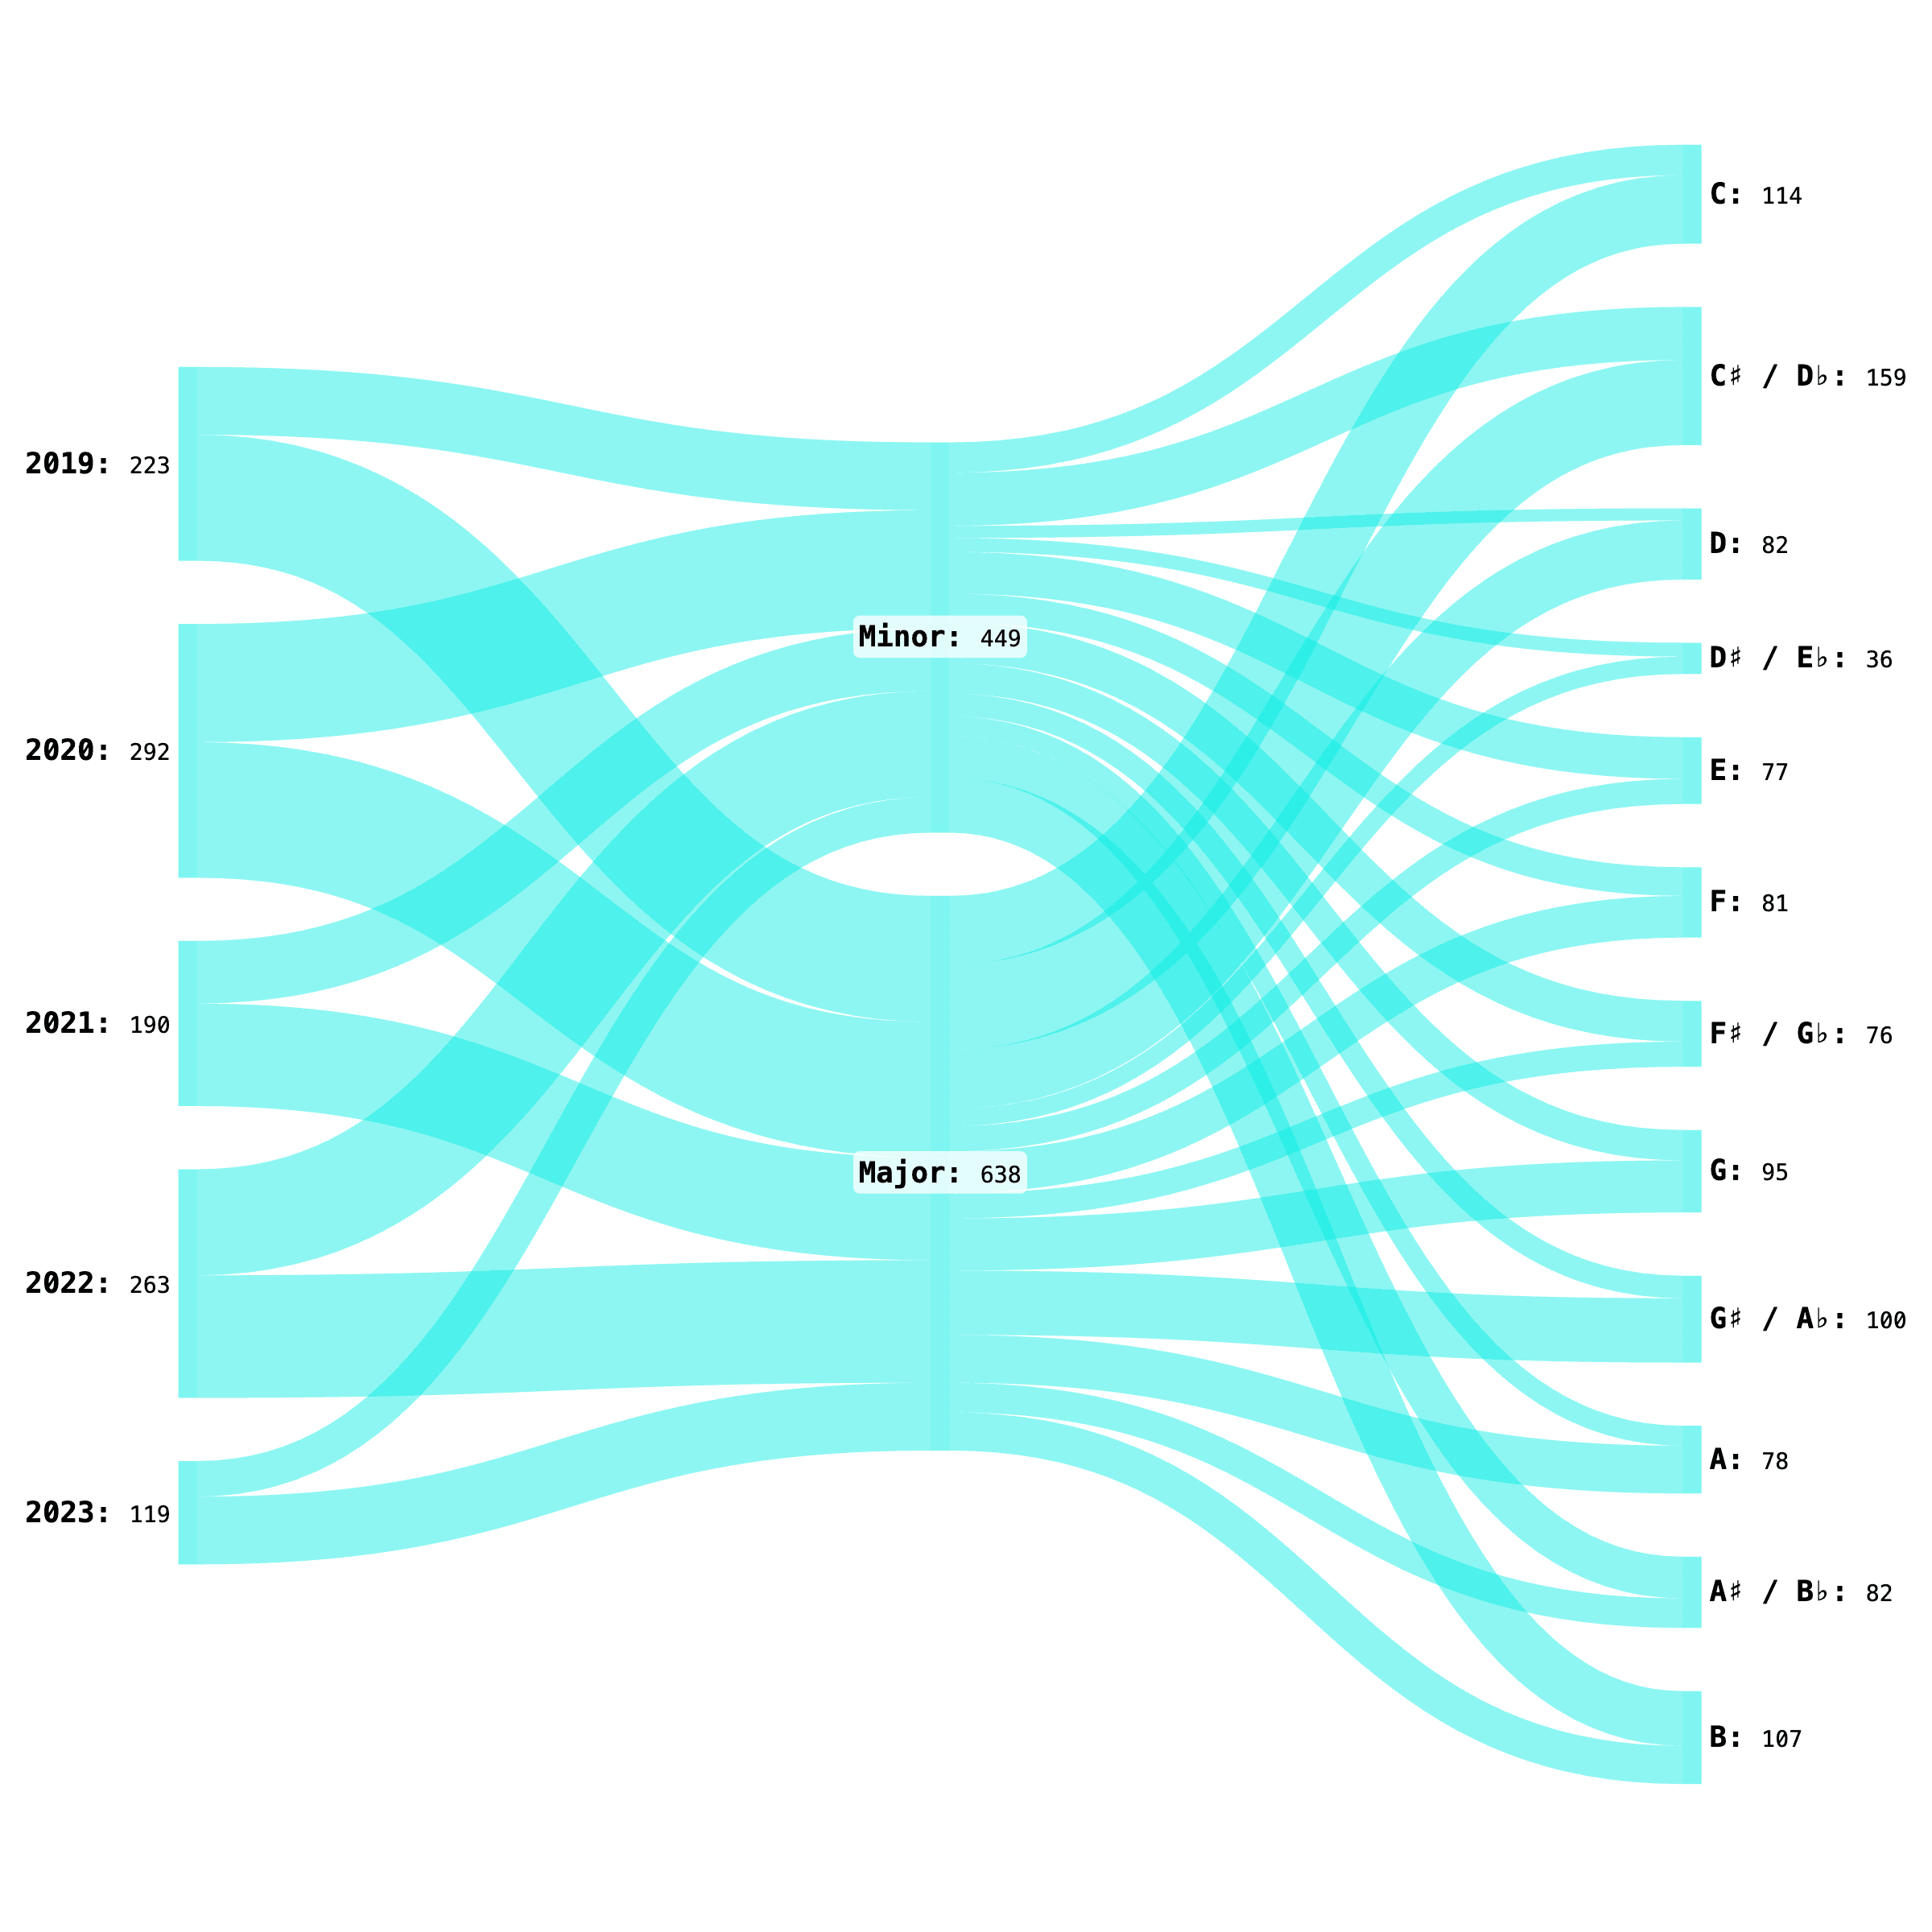
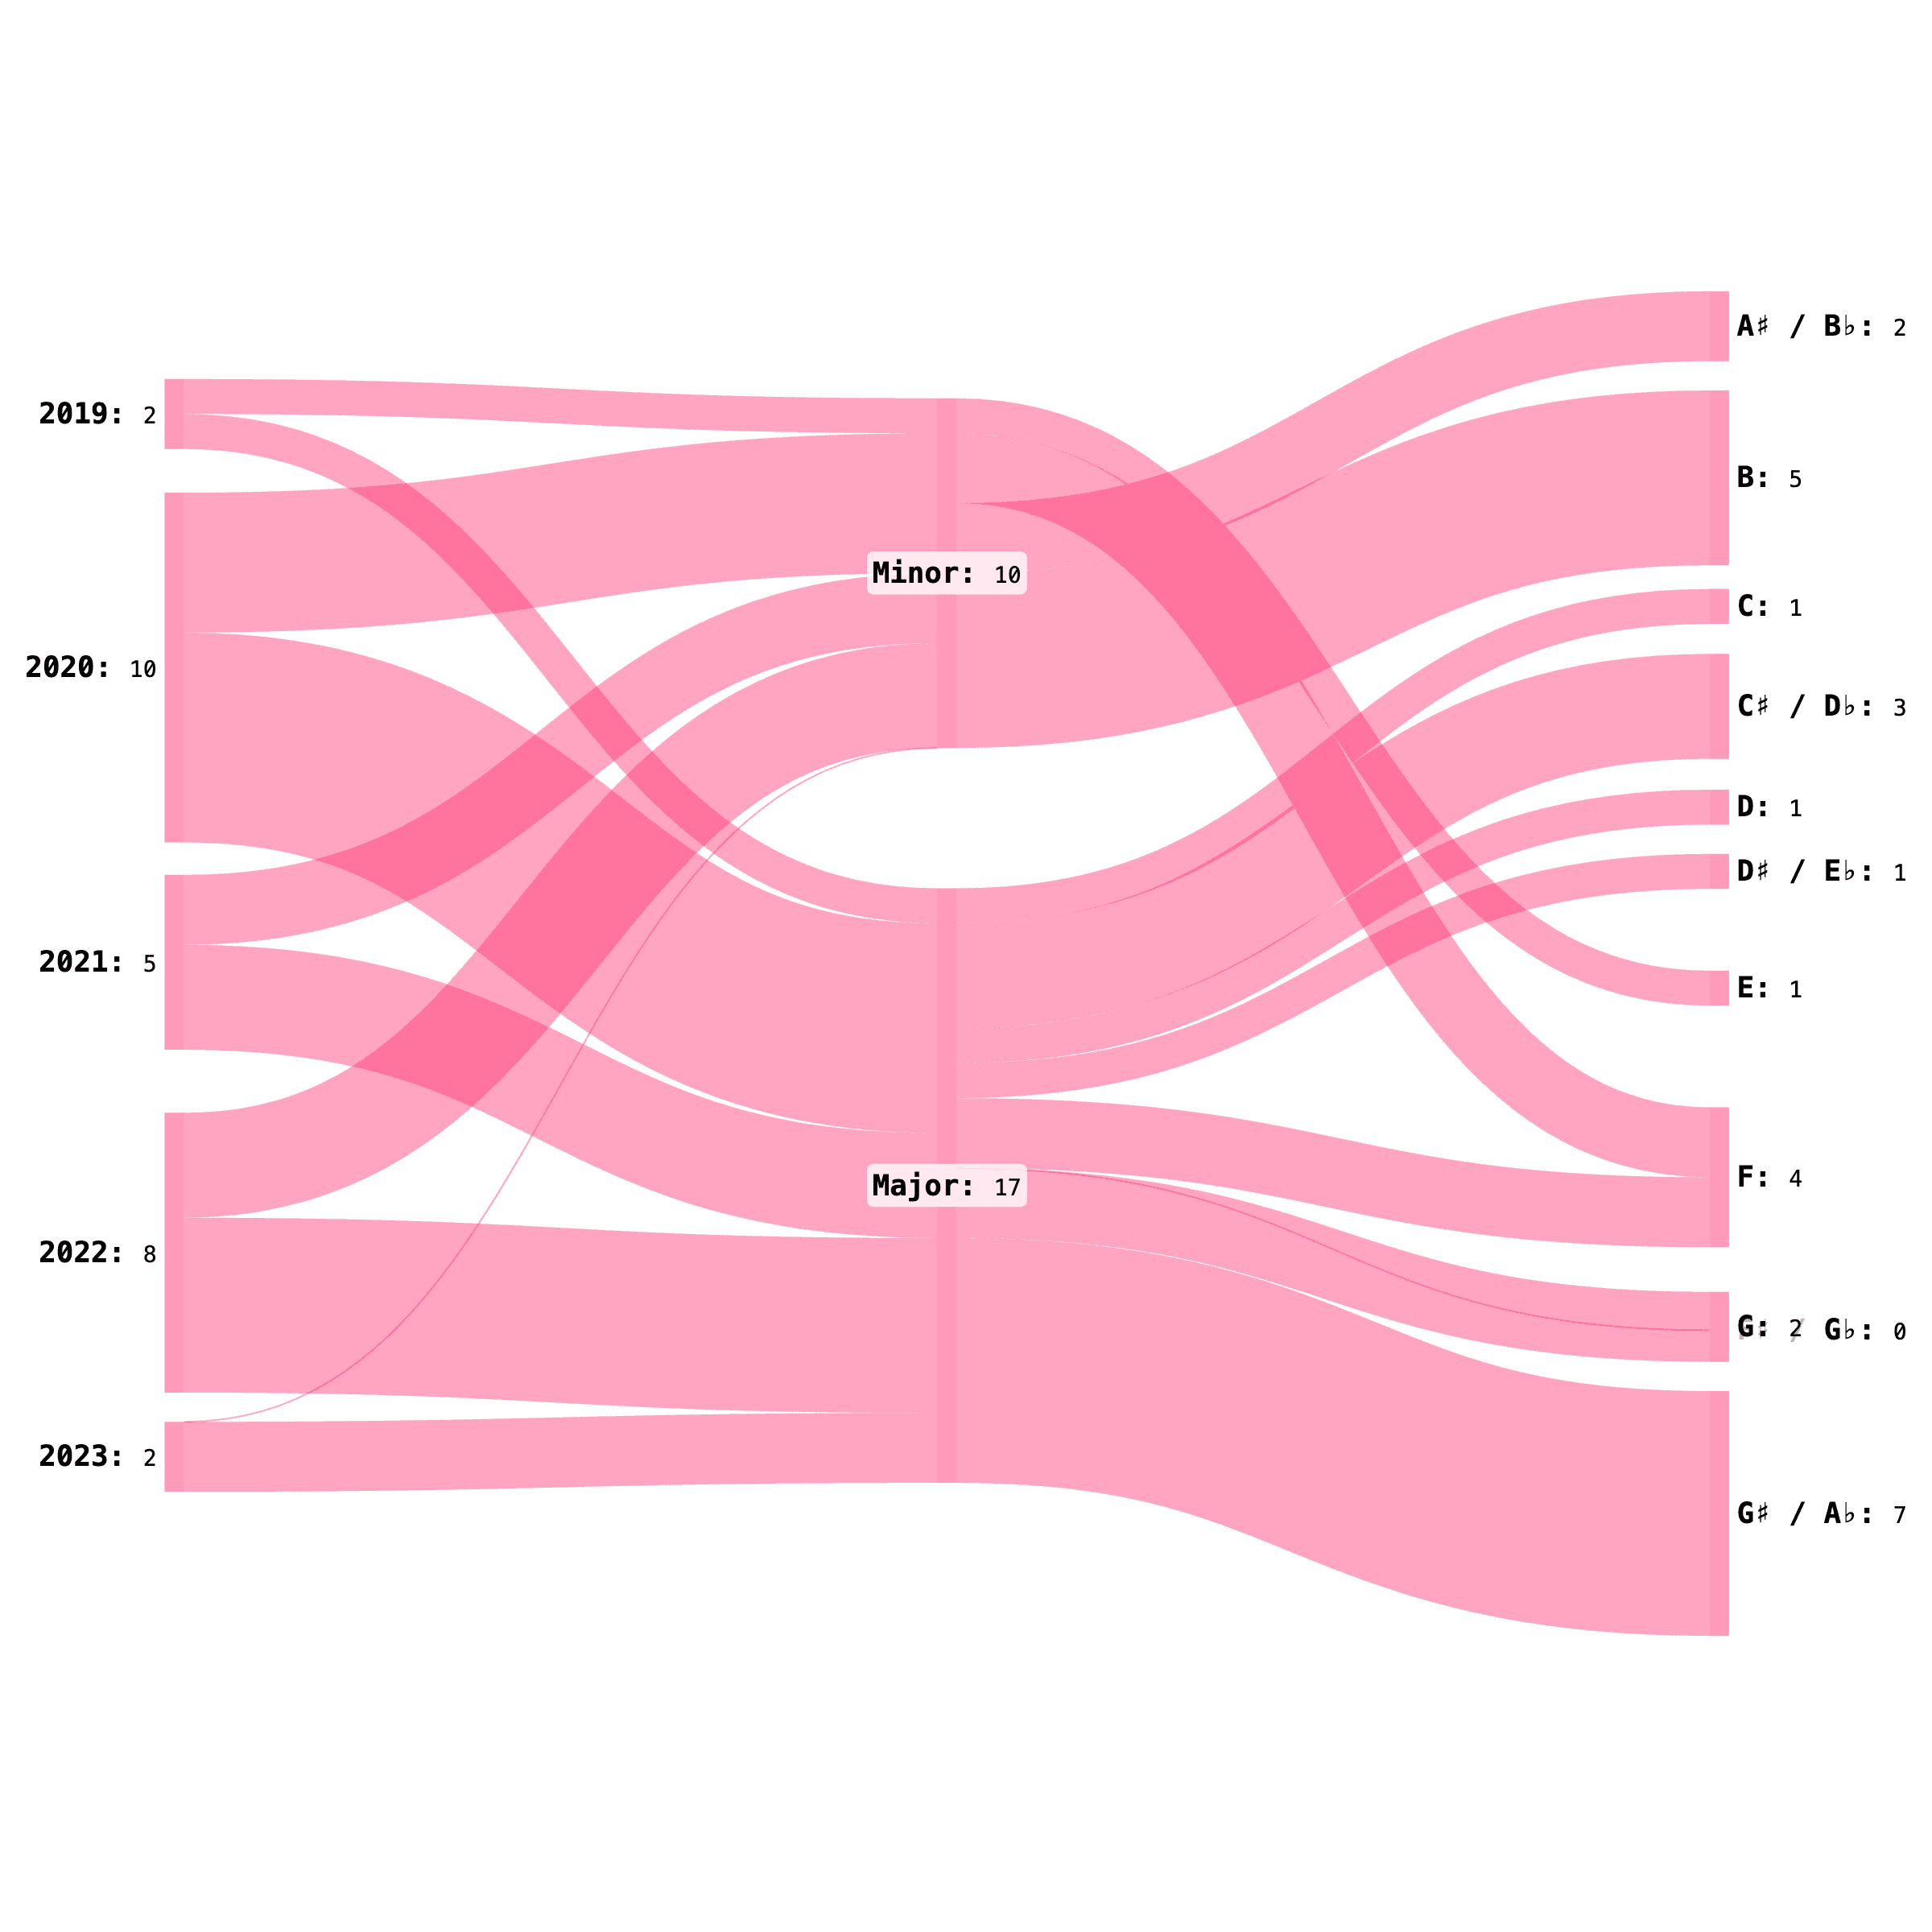
We analyzed datasets from Kaggle, containing information on popular TikTok songs from 2019 to 2022. These datasets were compiled using web scraping techniques, Spotify API data, and music charts. The data includes:
- Song Details: Track name, artist, album, track popularity
- Acoustic Features: Danceability, energy, loudness, tempo, speechiness, valence, etc.
- Popularity Metrics: Artist popularity and track popularity scores
Key Stakeholders and Use Cases
- Musicians & Artists: Identify viral trends while balancing creativity and TikTok-friendly elements.
- Music Producers & Record Labels: Leverage insights to enhance production and marketing strategies.
- Content Creators & Marketers: Optimize content strategies and predict upcoming music trends.
- Music Analysts & Researchers: Study correlations between musical attributes and virality over time.