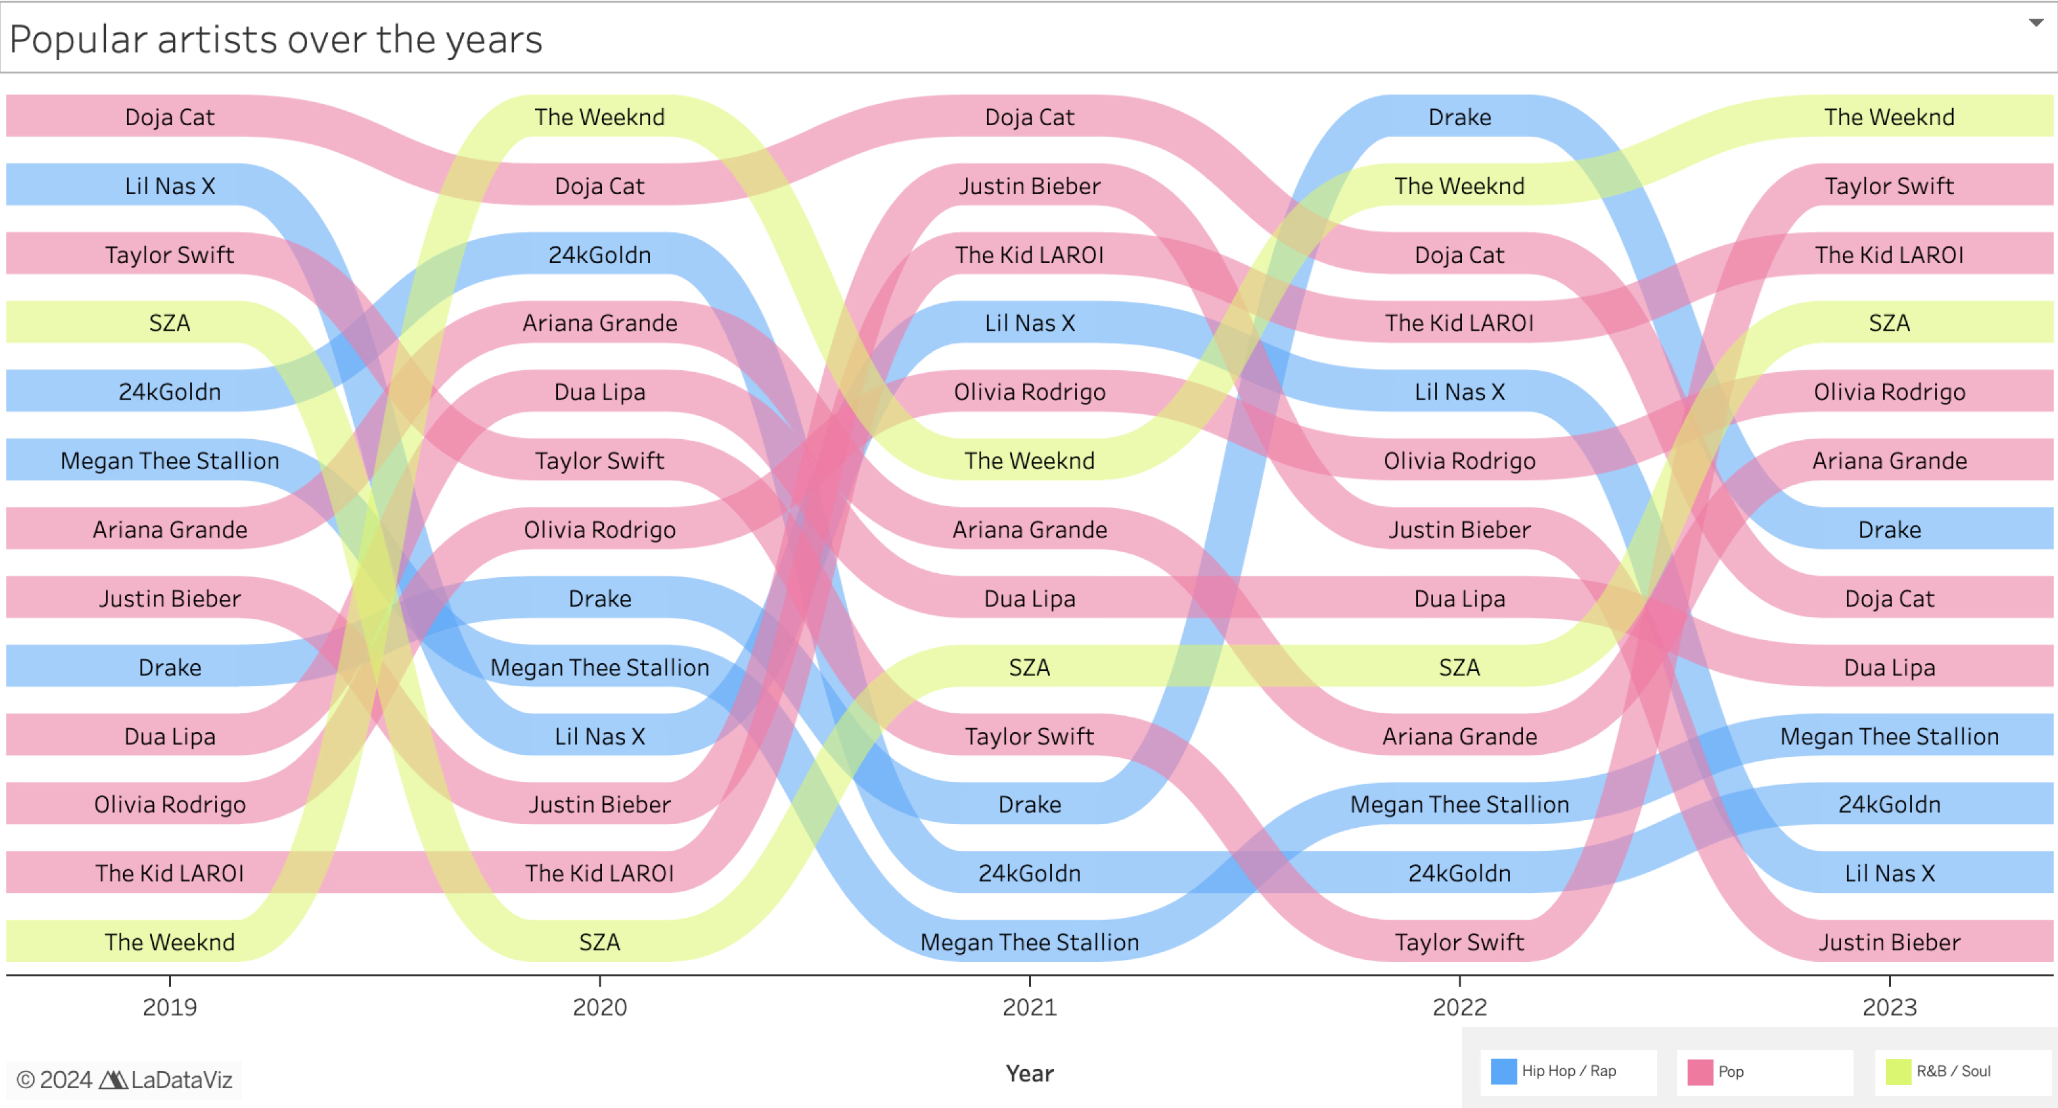
On TikTok, hits don’t launch—they erupt. This case study turns five noisy years into quick, scroll-stopping stories: who’s winning, who’s fading, and what sounds actually stick. Pop rules, R&B connects, and Doja Cat shows how one spark can light a career.
TikTok has transformed the music industry by making virality a key driver of success. However, this algorithm-driven popularity has also led to a homogenization of sound, with artists optimizing their music to fit TikTok trends.
This project explores how data visualization can help uncover the patterns behind viral TikTok songs and provide insights for artists, producers, and industry professionals.
We analyzed datasets from Kaggle, containing information on popular TikTok songs from 2019 to 2022. These datasets were compiled using web scraping techniques, Spotify API data, and music charts. The data includes:
Song Details: Track name, artist, album, track popularity
Acoustic Features: Danceability, energy, loudness, tempo, speechiness, valence, etc.
Popularity Metrics: Artist popularity and track popularity scores
Musicians & Artists: Identify viral trends while balancing creativity and TikTok-friendly elements.
Music Producers & Record Labels: Leverage insights to enhance production and marketing strategies.
Content Creators & Marketers: Optimize content strategies and predict upcoming music trends.Music Analysts & Researchers: Study correlations between musical attributes and virality over time.
After gathering our data and defining our objectives, we initially explored it in Excel to identify emerging trends. Once we noticed patterns, we transitioned to Tableau for more advanced visualization and interactive analysis.
During our exploration, we discovered that Doja Cat’s breakthrough success was largely driven by the viral spread of her song Say So on TikTok, making her an ideal case study for our project.
To ensure compatibility with Tableau, we reformatted and structured the data accordingly. We then iteratively refined our visualizations, experimenting with different representations before finalizing the prototype.
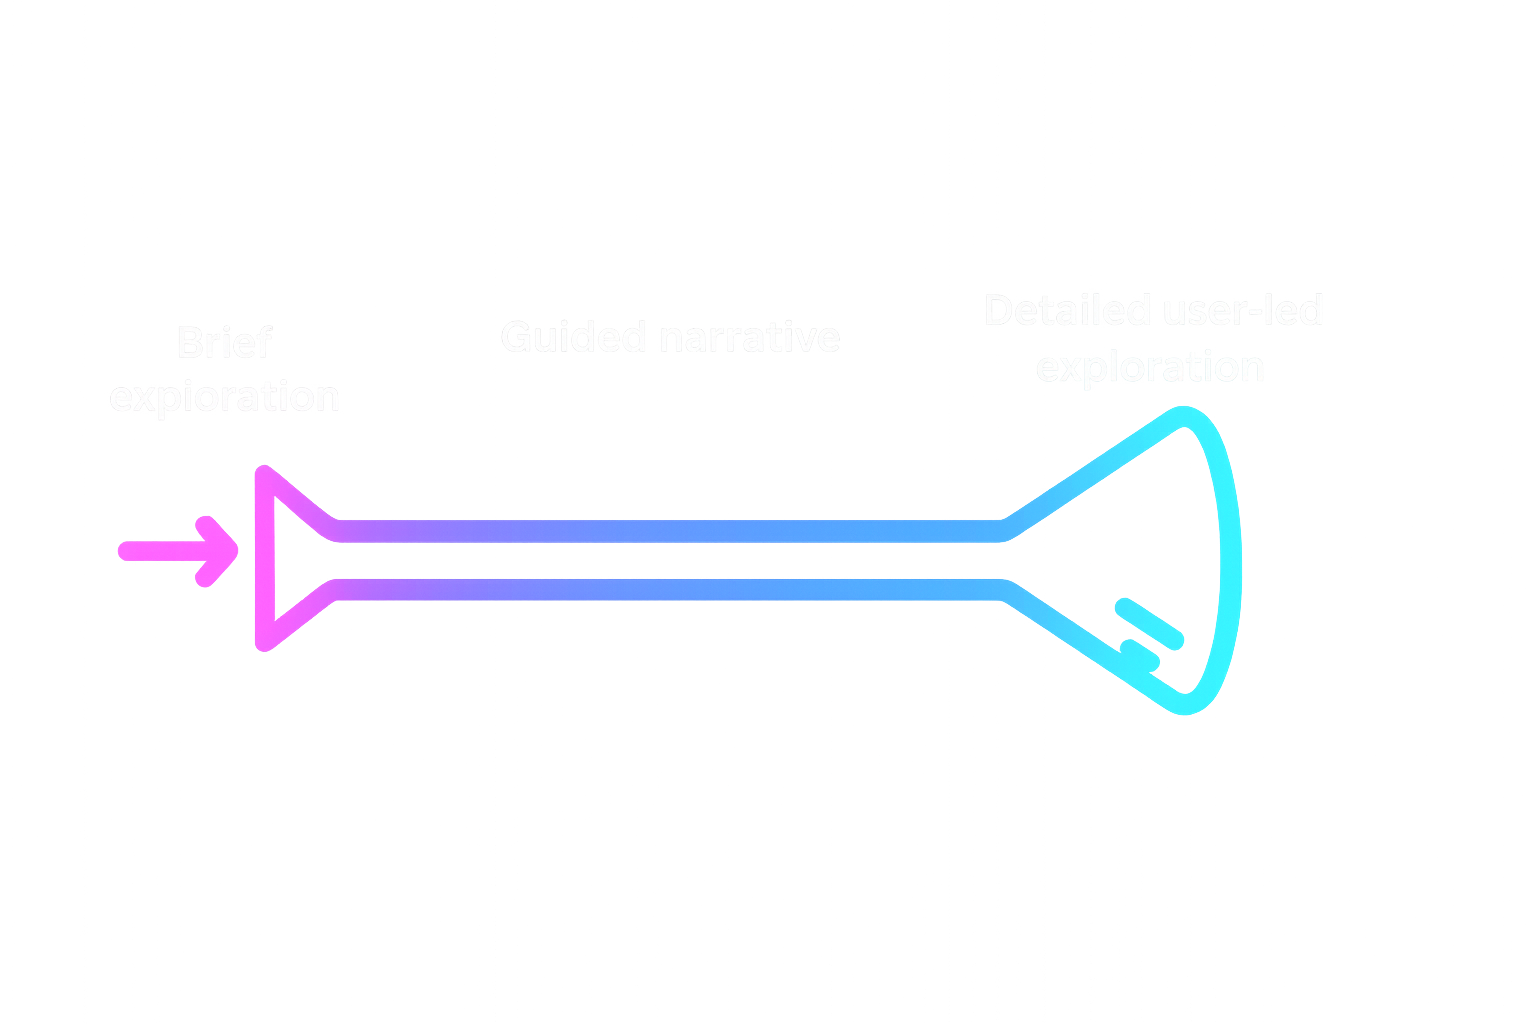
For the overall structure, we followed a martini glass approach—starting with a brief exploratory phase, guiding the audience through key insights, and then allowing them to freely explore the data on their own.
Finally, we identified key insights to support users during the guided exploration phase. Using Doja Cat as an example, we demonstrated how our tool can be leveraged to explore different artists and trends, helping users navigate and interpret the data effectively.
We then built the prototype on Framer to effectively present our case study and showcase our findings.