Community banks and credit unions need clear, fast answers on where they stand and what to do next. This project delivers an analyst-first dashboard that benchmarks deposit and credit products using FDIC/NCUA data and layers in AI-driven predictive modeling—turning manual, spreadsheet-heavy work into concise, actionable visualizations for smarter pricing decisions.
Community banks and credit unions price deposits and credit products by benchmarking against regional peers and national averages from FDIC and NCUA. Beyond staying market-relevant, they must maintain compliance-critical ratios like Loan-to-Share, Return on Assets (ROA), and Net Worth, which makes timely awareness of competitor moves essential.
The Current Reality
Despite the stakes, the workflow is manual, subjective, and time-intensive. Analysts and CXO teams scrape reports, stitch spreadsheets, and build one-off decks with minimal automation, slowing reaction time and introducing inconsistency.
Market Gap
Enterprise platforms (e.g., Curinos-style tools) aggregate this data but are priced out of reach for smaller institutions. Consumer sites like Bankrate enable customer comparison, not bank-to-bank competitive analysis. Large banks solve the gap with specialized quant teams and predictive/AI modeling; smaller institutions typically cannot, creating a clear opportunity for a lightweight, affordable, data-driven benchmarking and pricing product.
Product Analytics Dashboard
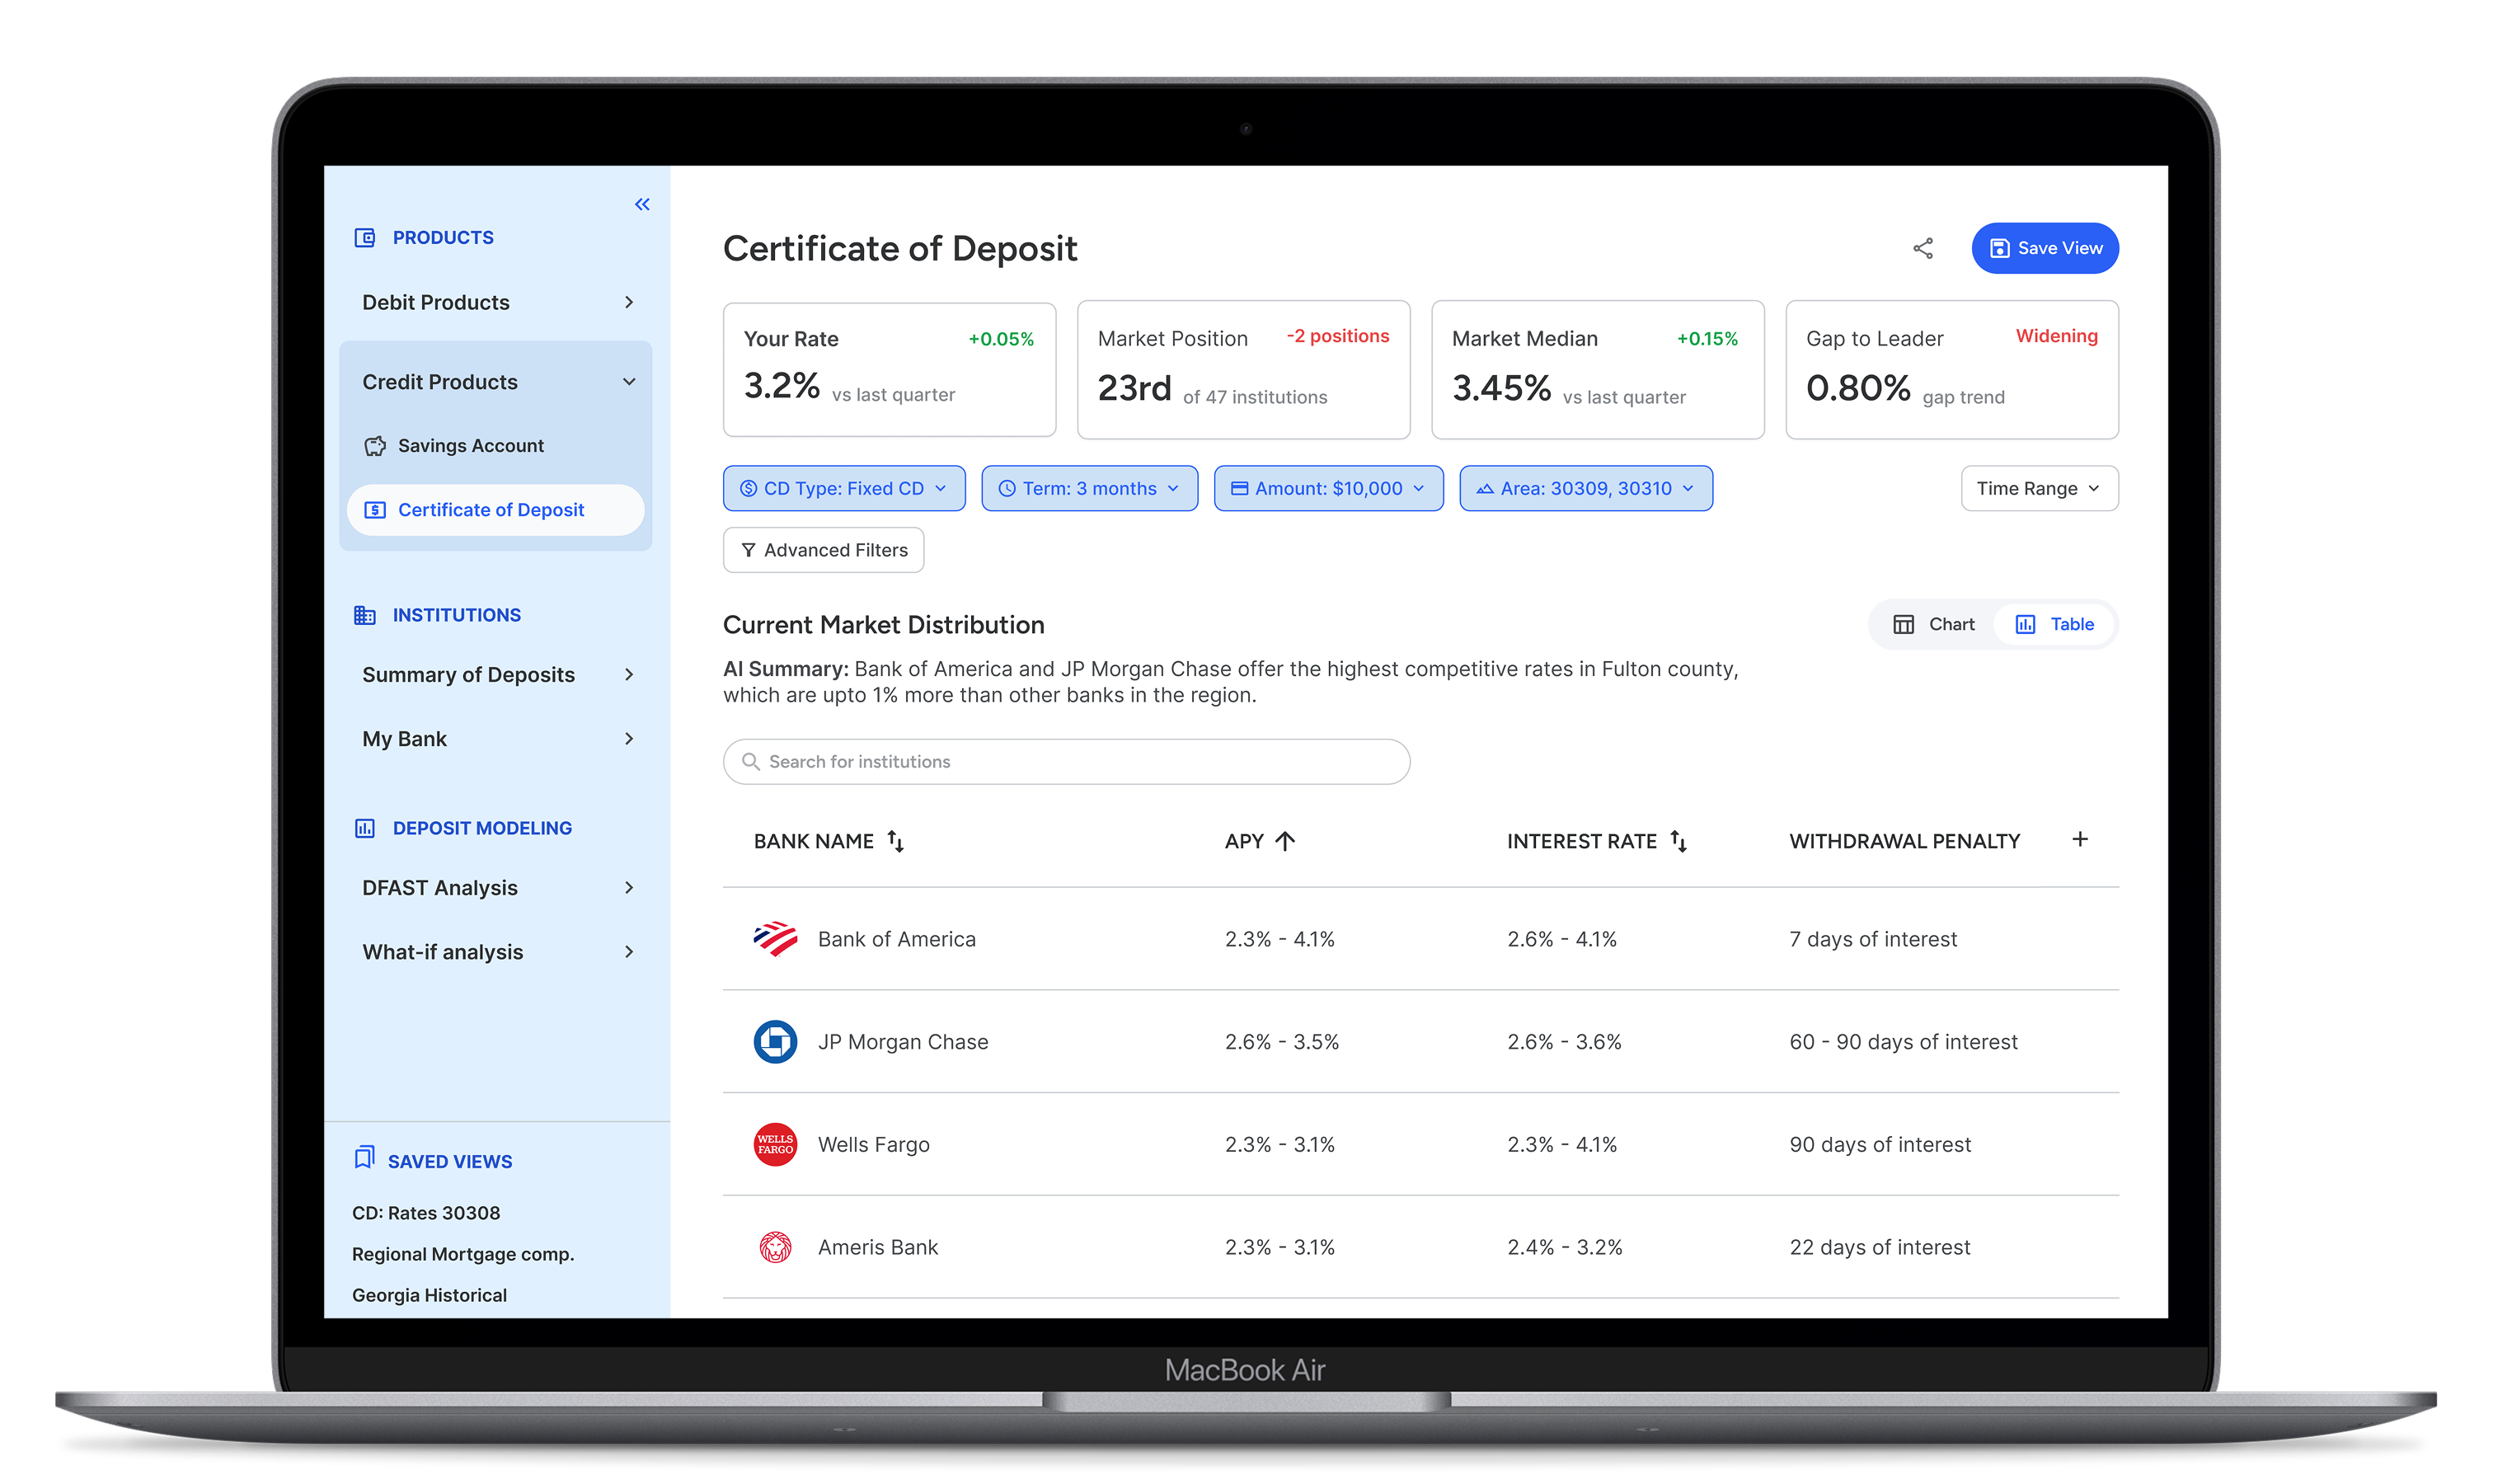
A benchmarking tool for banks and credit unions to compare deposit and credit products (e.g., CDs, mortgages) against competitors. It combines comprehensive filters (product, term, amount, institution type, geography, demographics) with rate controls (interest/APY, fees, withdrawal penalties) to model pricing scenarios. Data is surfaced through a table view for side-by-side comparisons, interactive charts for trend insight, and comparison cards that flag averages, gaps, and outliers—delivering a clear snapshot of market position to guide pricing and rate-setting decisions.
Predictive Modeling
A forecasting workspace to simulate product performance under changing economic and market conditions. Users select deposit or credit products, set a target APY, and adjust parameters—APY/product type, GDP growth, unemployment, 3-yr/10-yr Treasury yields, House Price Index, and other macro or institution-level indicators. The model outputs Base / Best / Worst Case projections over a user-defined quarterly or annual horizon, delivering actionable guidance for pricing, rate adjustments, and portfolio risk.
Discovery
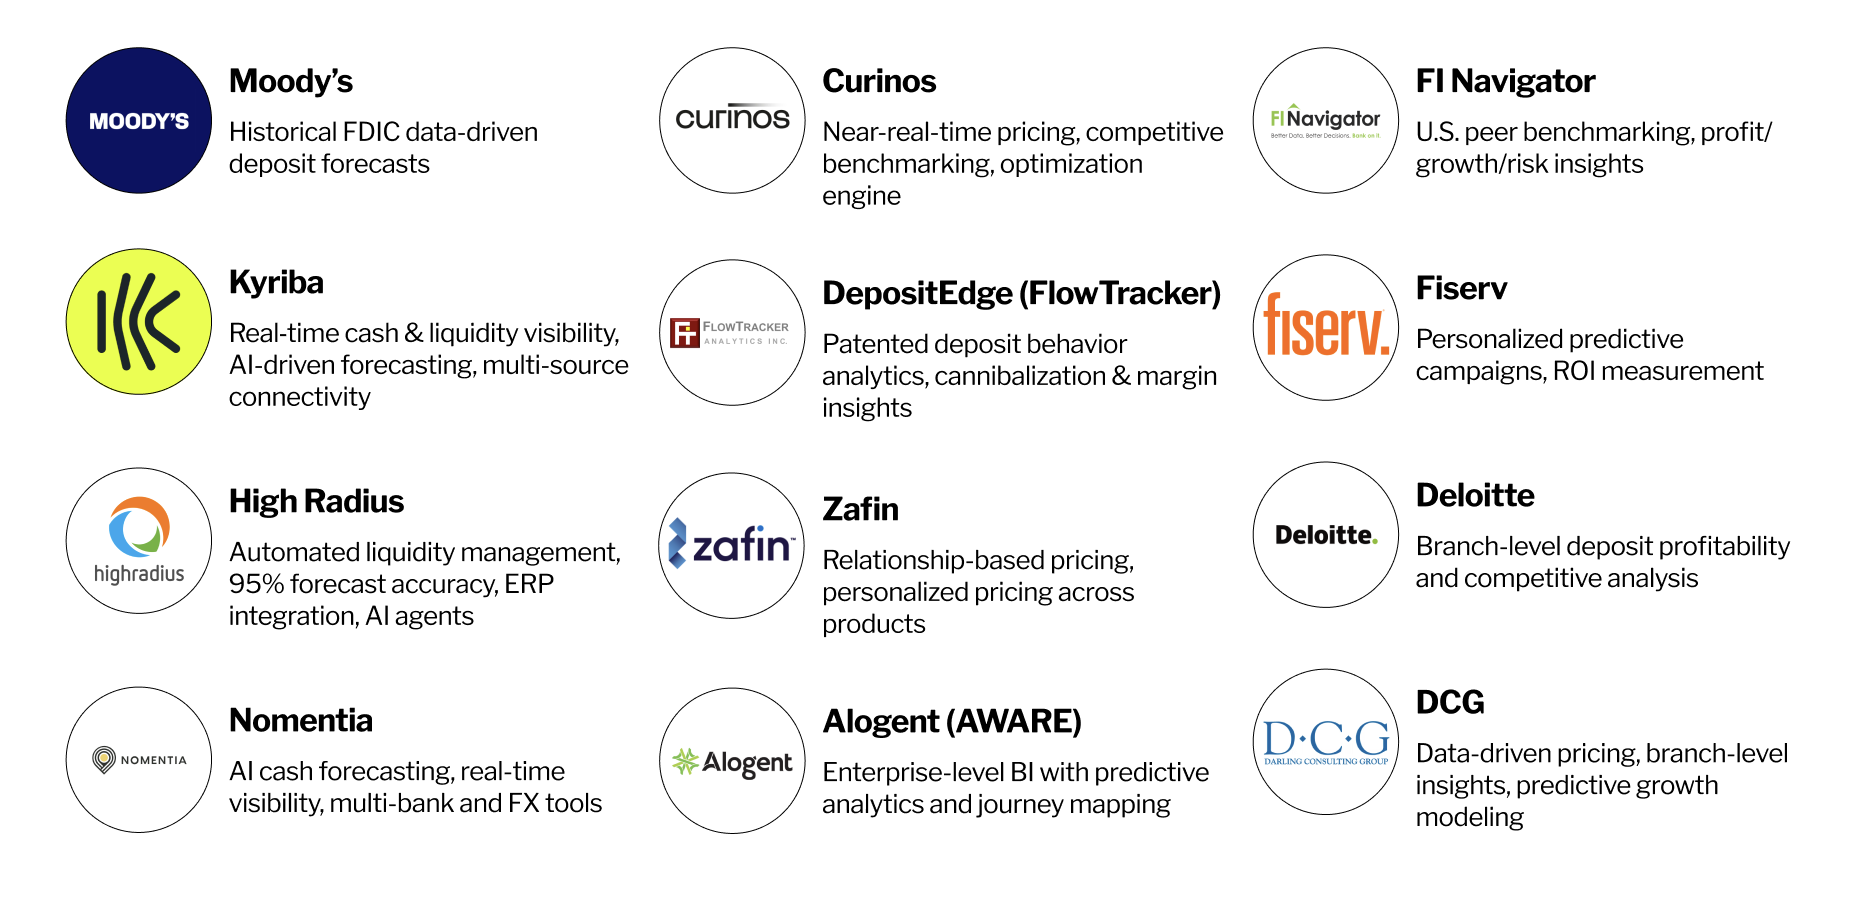
To size the opportunity, we began with a competitive scan to map adjacent products and identify where a bank-facing benchmarking tool could fit (see slide of competitor logos). We found no viable options for community banks and credit unions—most offerings target consumers or are enterprise-priced and out of reach.
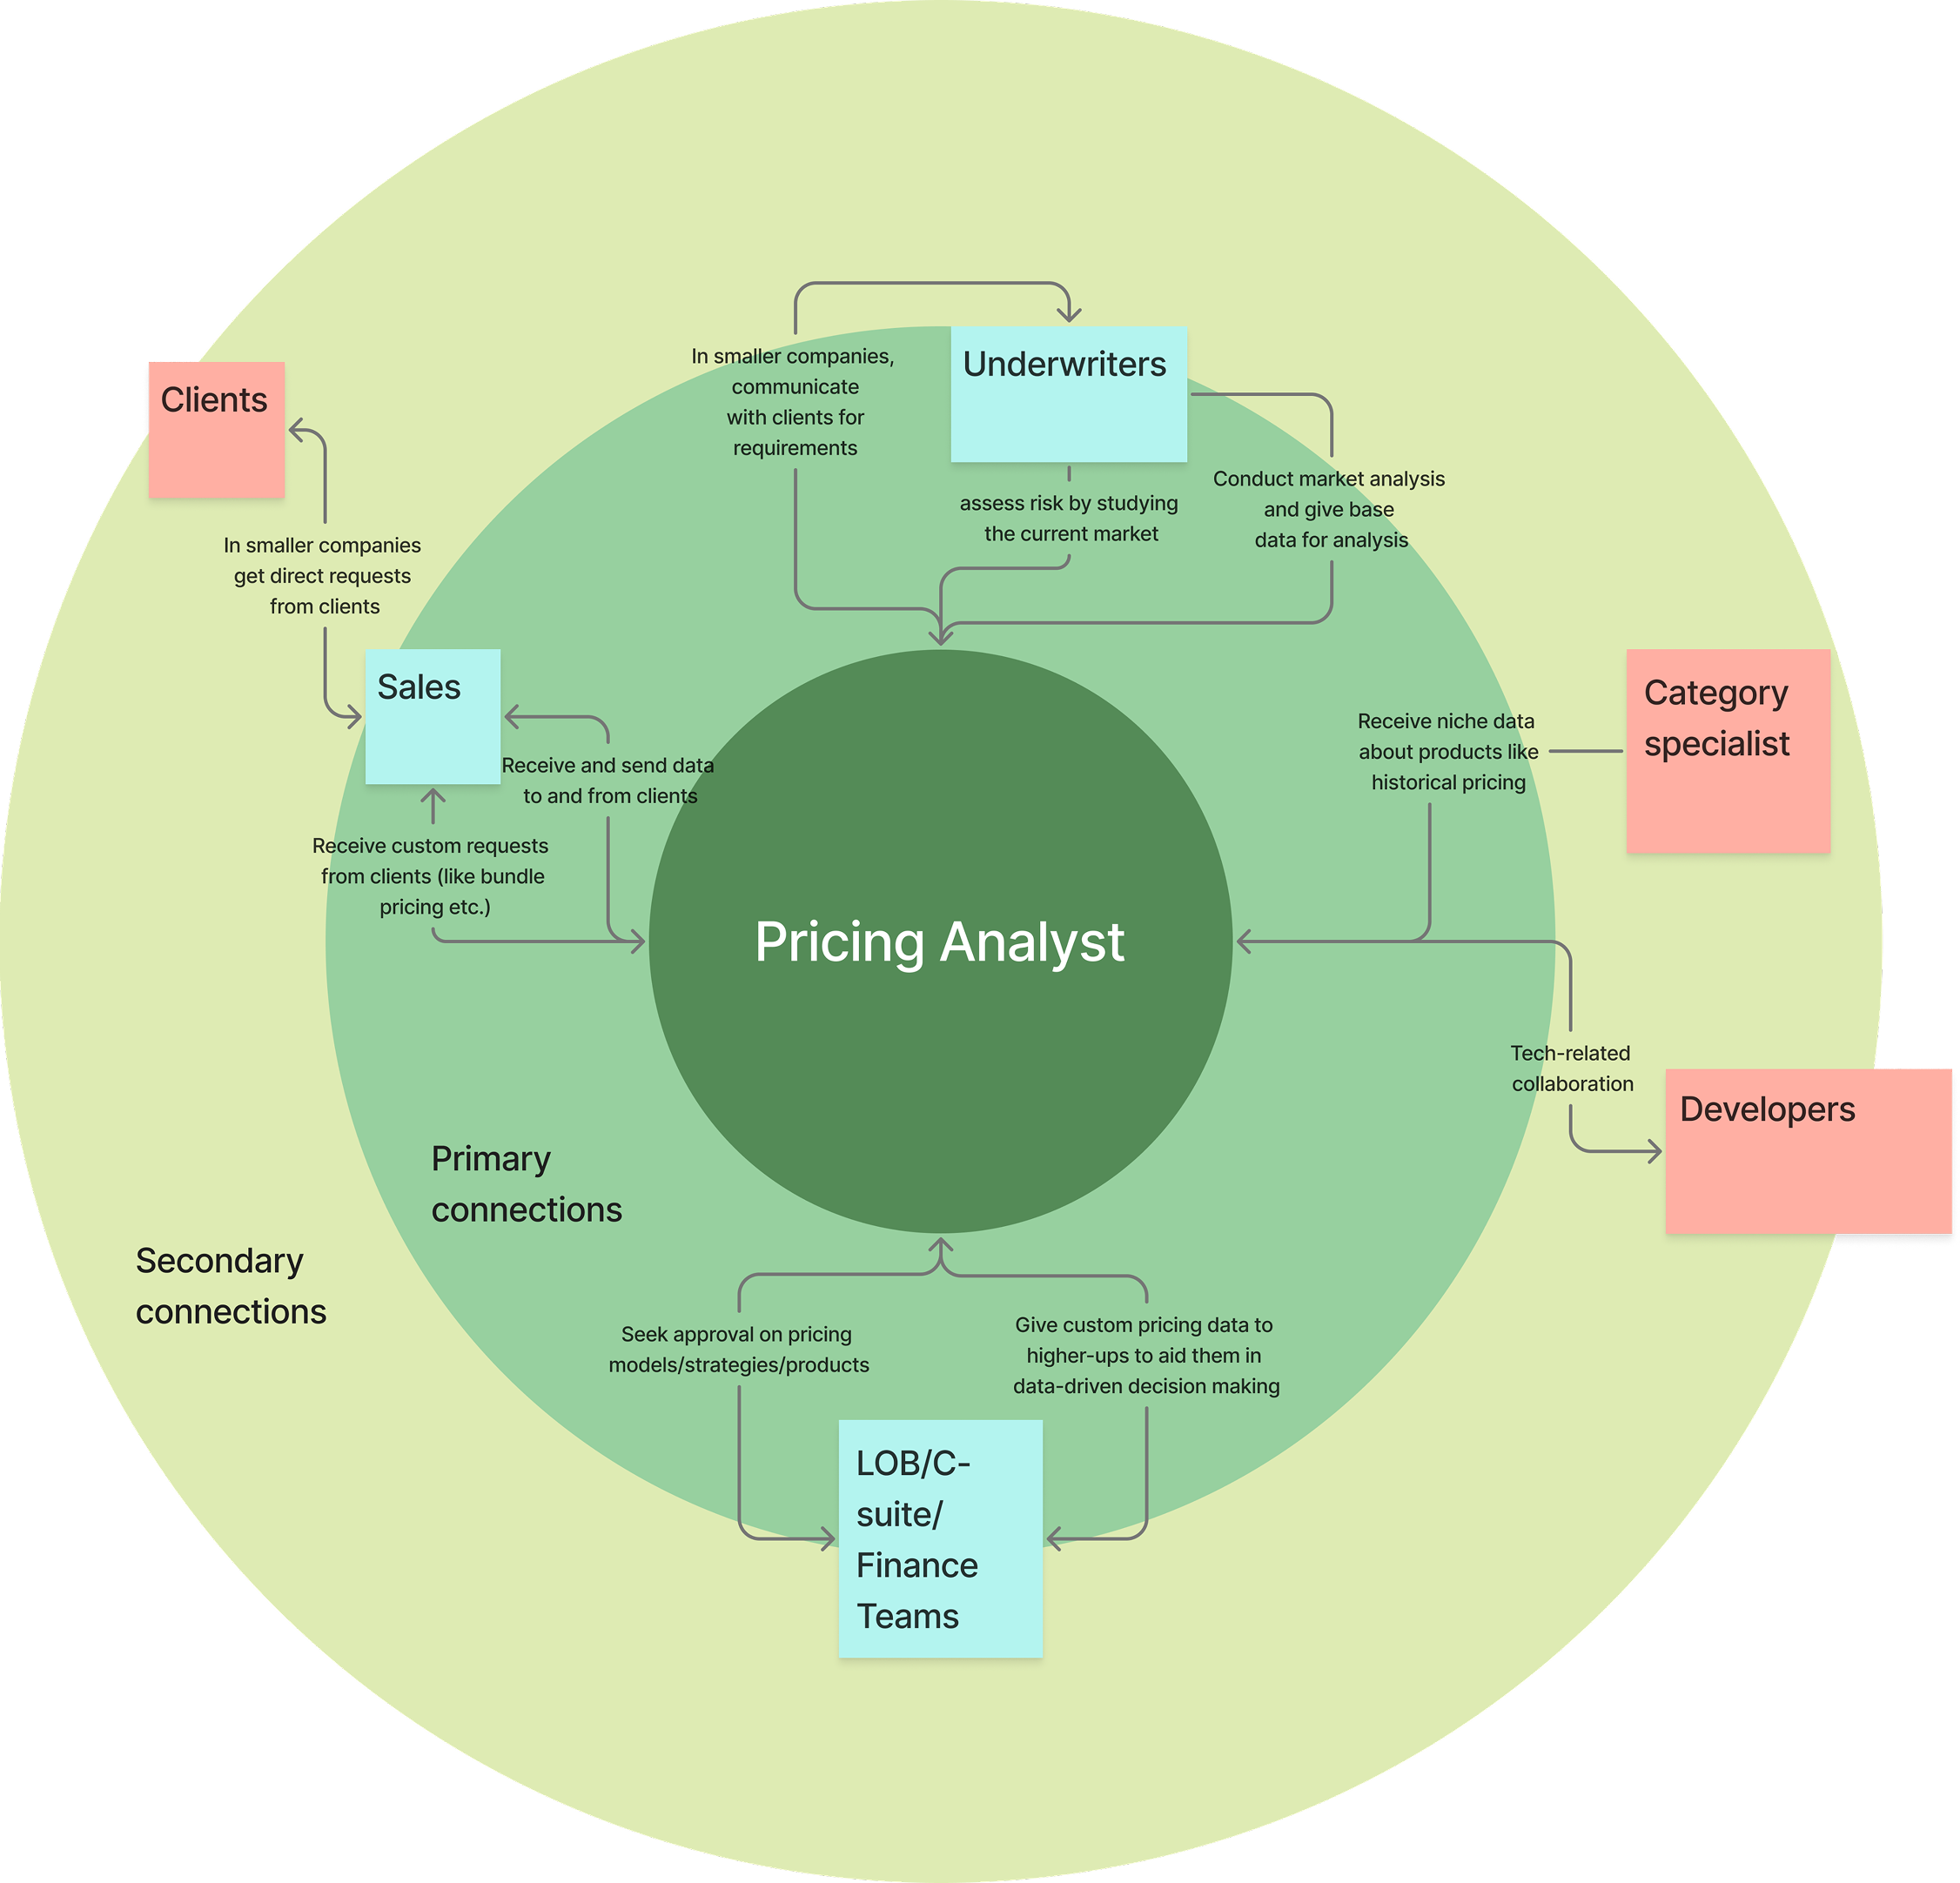
Next, we conducted workflow interviews with pricing analysts and stakeholders at Bank of America, Charles Schwab, Experian, and several local institutions to understand theri work flows and requirements. The pattern was clear: large institutions already benchmark competitors via in-house tools or third-party platforms, while smaller banks and CUs rely on manual, spreadsheet-driven processes to brief executives.
As one Georgia credit union CXO put it, “A tool like this could be very useful—reducing manual work, especially when analysts need to communicate with higher-level decision-makers.” This feedback validated our hypothesis: there’s a real gap for an accessible, analyst-friendly benchmarking tool purpose-built for smaller financial institutions.
Requirement Finding
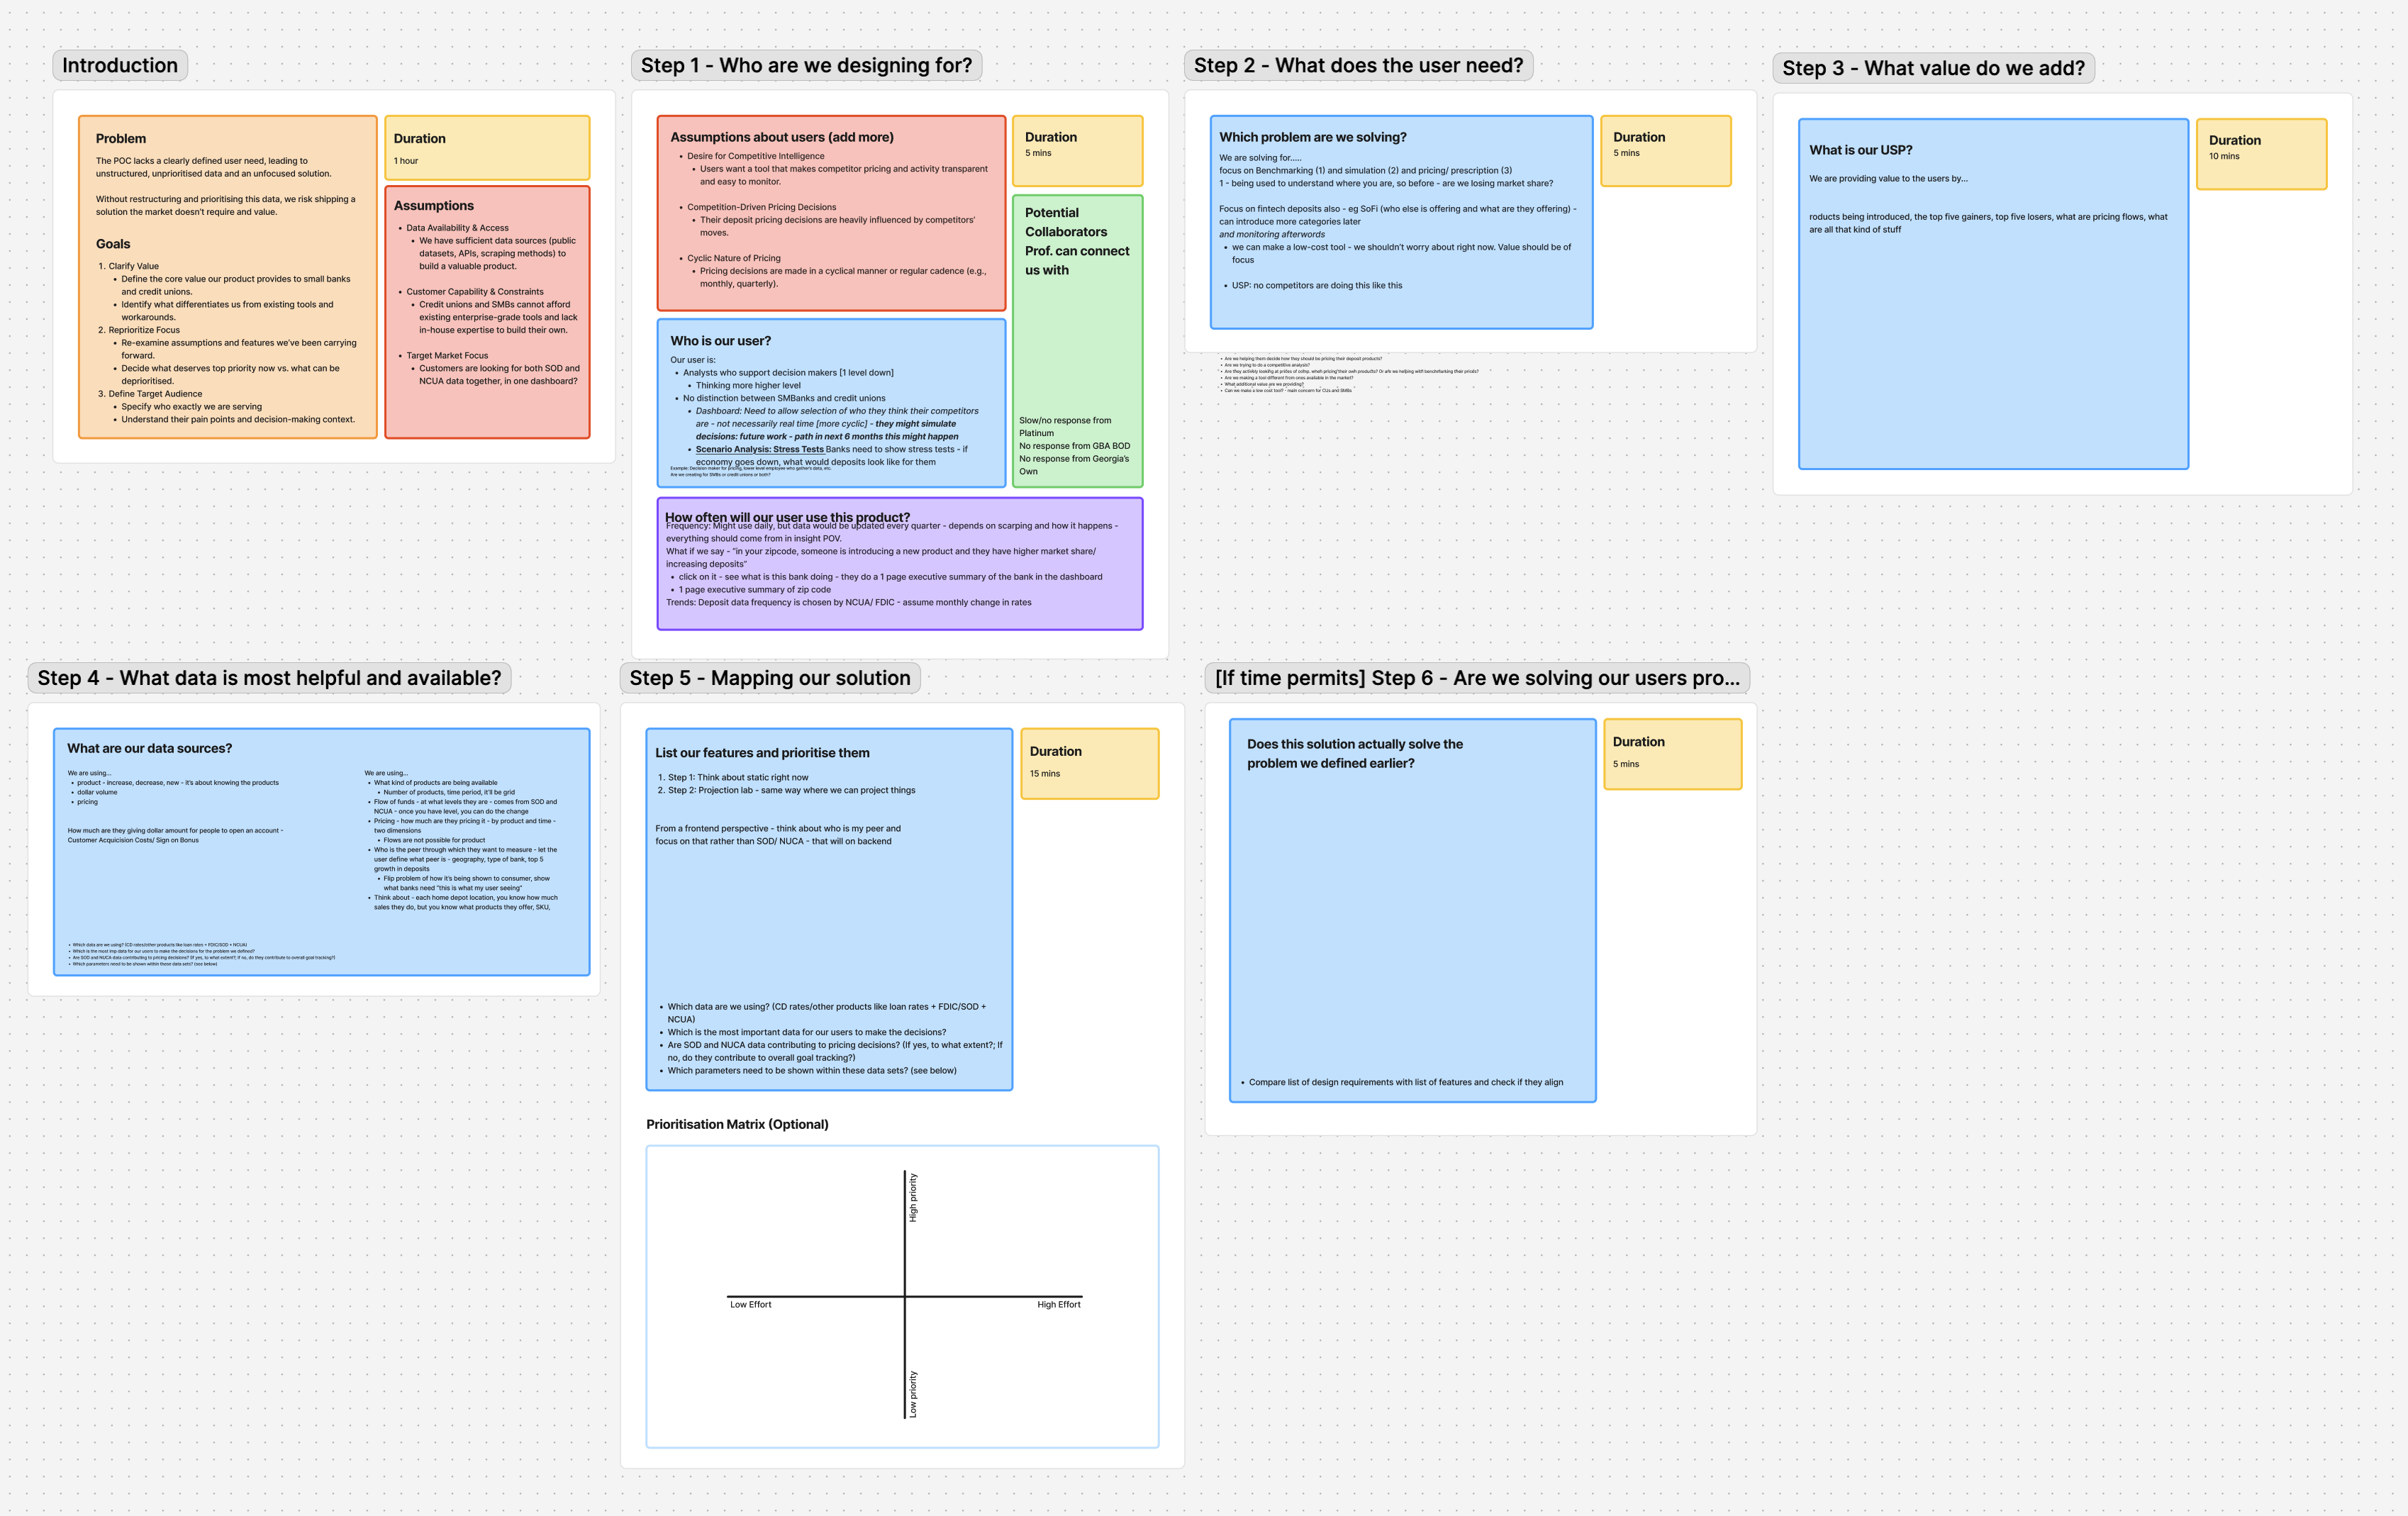
We began with an internal analysis to frame a focused workshop plan, then ran stakeholder workshops to confirm business viability, technical feasibility, and data credibility. These sessions clarified the end-to-end workflow, surfaced decision points, and let us nail down inputs/outputs and success criteria. In parallel, we distilled the outcomes into a working PRD with the PM, translating insights into crisp, testable requirements.
1) Low → Mid-Fi Sketches
Sketched core flows (filters, comparisons, readouts) to validate information hierarchy and analyst tasks without UI noise.
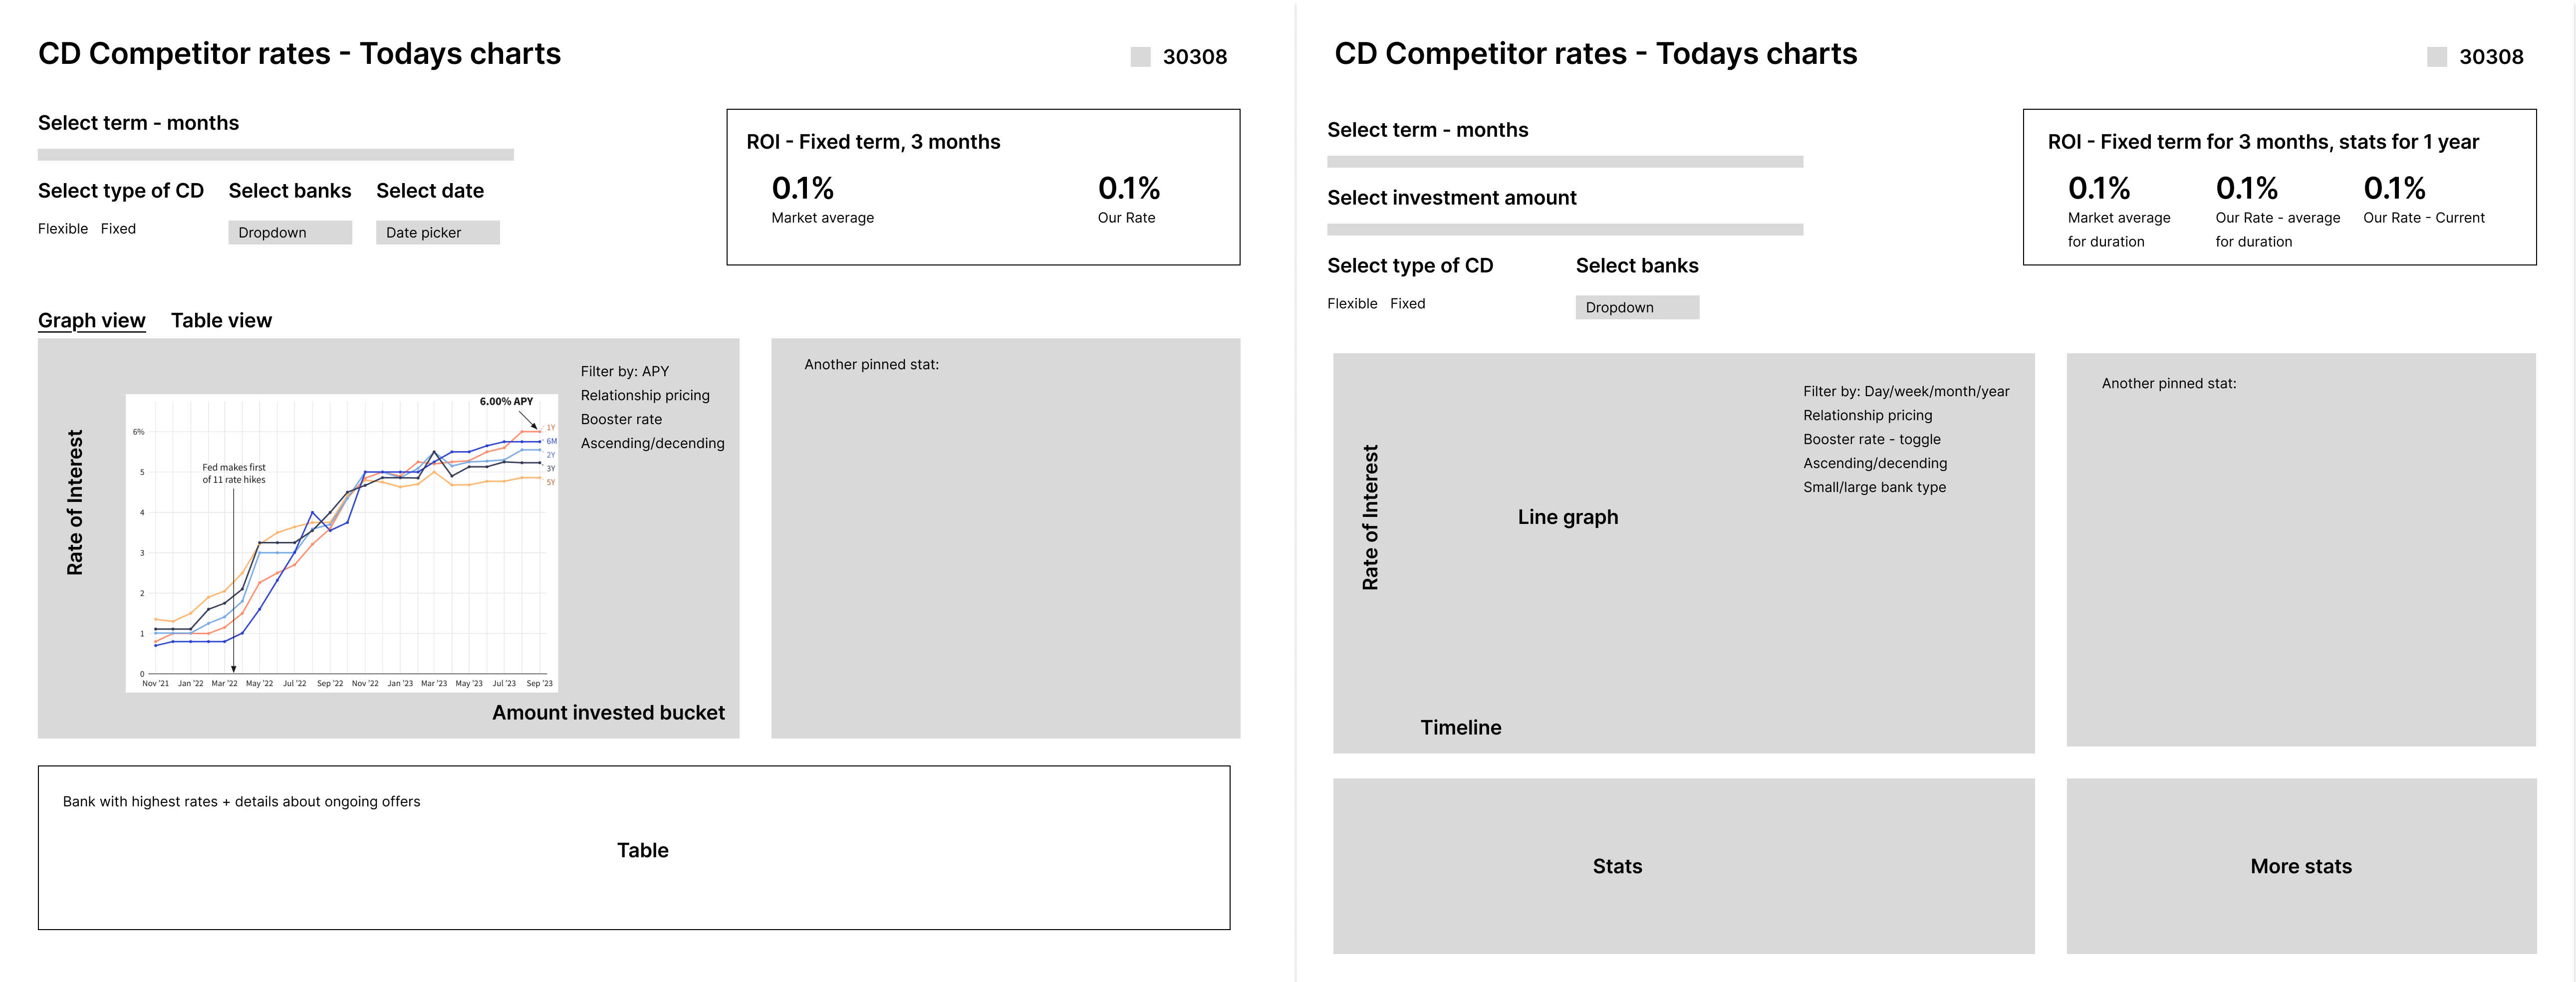
2) v0 Build (Iteration 1)
Stitched a working prototype to exercise data pathways and interactions; gathered targeted feedback from stakeholders on navigation, terminology, and decision cues.
3) Back to Figma: Hi-Fi + Annotations
Produced high-fidelity screens with detailed annotations (e.g., CD rate flow) to clarify states, inputs, and outputs. Feedback revealed we’d coupled institution and product context too tightly—showing current rates then trends in one place. We decoupled views:
- Institution view for zoomed-out market posture (leader/average/selected, share shifts).
- Product view for granular pricing (rates, terms, fees, outliers).
This split improved scannability and matched analyst mental models; we refined layouts, labels, and comparison patterns accordingly.
4) v0 Build (Iteration 2)
Implemented the revised IA and shipped two pivotal capabilities:Saved Views to preserve reusable filter setups and speed analyst-to-CXO handoffs.Predictive Modeling (Base/Best/Worst) with adjustable inputs (APY, macro indicators) to simulate pricing scenarios over chosen horizons.

We secured stakeholder sign-off on scope, the Institution↔Product IA split, and decision cues, then piloted with a small Georgia credit union to validate real-world fit. Their feedback surfaced a need for deeper counterparty context, which we addressed by adding the Bank Profiles module (financials, risk, compliance, rate posture). The CU has committed to integrating the dashboard into their pricing workflow once the predictive-model backend is fully productionized, and we’re formalizing a partnership to support ongoing iterations.
Targeted pilots & usability cycles
Run more tests with varied banks/CUs; tailor modules, metrics, and permissions to each institution’s workflows.
Model & platform maturity
Partner with ML/data engineering to harden the predictive backend (feature set, validation, monitoring) and deepen integrations for a more sophisticated, reliable system.